
February 2025 Volumes and Global Trade Insights: A Deeper Dive into the Decline
Global Volumes See Sharp Drop
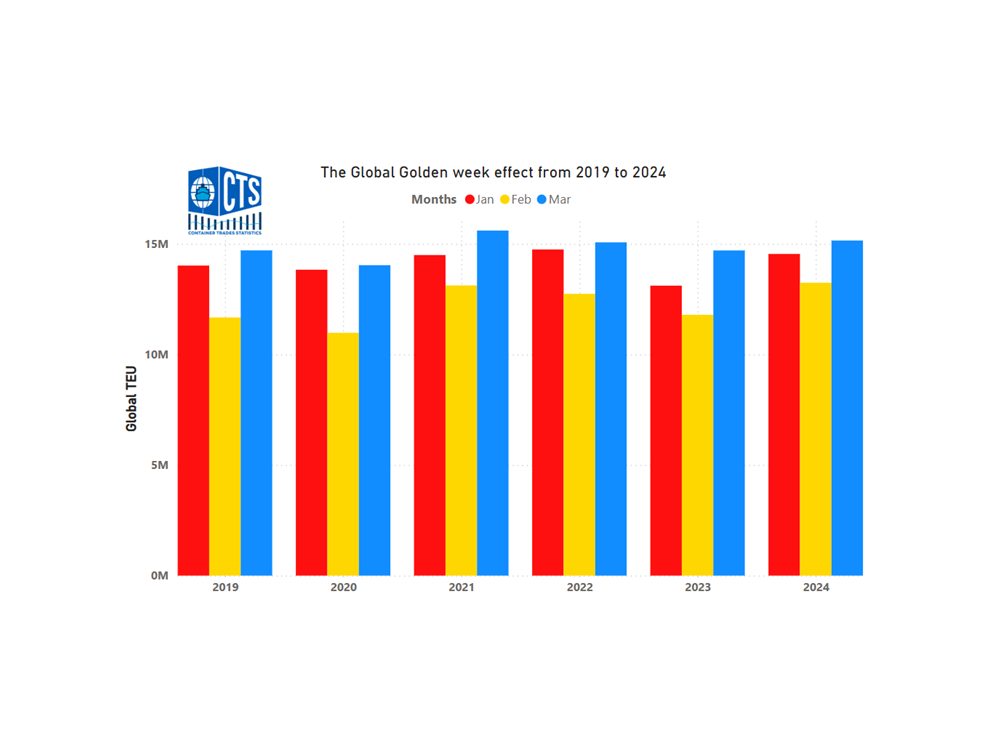
As is typical in most years, a dip in global volumes was anticipated in February due to the Chinese New Year, which brings about the Golden Week Effect on volumes. However, despite this expectation, the significant drop in February 2025 volumes came as a surprise. Volumes in February stood at 13.1 million TEUs, reflecting a 13.6% decrease from January 2025 and a 0.7% decline compared to February 2024. Notably, in February 2024, the month-on-month drop from January was only -8.9%, highlighting the sharp decline observed in February 2025. The last time we saw such a significant drop from January to February was in 2022, with a similar 13.6% decrease.
February Import Pullbacks
On an import basis, all regions experienced a pullback as we entered February 2025. North America, unsurprisingly, saw one of the largest declines, with imports dropping by 17.4% month-on-month. However, year-on-year, imports are still up marginally by 2%. This sharp decline is largely due to the predictable withdrawal in Far East exports, which is further exacerbated by the effects of US import duty tariffs, inevitably slowing trade.
Europe also faced a significant decline in imports, with a month-on-month drop of 18.7%, and a 4% decrease compared to February 2024. As with North America, this decline is attributed to reduced exports from the Far East, as the region shut down for Chinese New Year. However, the drop in 2024 from January to February was only -4.5%, indicating that other factors beyond the Golden Week effect contributed to the larger decline observed in 2025.
Exports on Main Trades Also See Declines
In terms of exports, the Far East and Indian Sub-Continent & Middle East experienced the sharpest declines, with reductions of 22.7% and 7.9% respectively. However, on a year-on-year basis, both regions saw an increase of 2%, underscoring the remarkable volumes that have been consistently observed over the past four months. Despite the significant month-on-month drops, the year-on-year data still reflects strong performance.
Surprising Growth in Smaller Areas
Australasia and Oceania experienced the largest month-on-month export growth in February 2025, surging by 19.5%. However, this increase only translates to an additional 14,000 TEUs. Compared to February 2024, exports in this region are up by 6%, continuing a steady upward trend since 2022.
Global Price Index
While the past two months have been challenging, November serves as a reflection of the evolving patterns that have shaped 2024. North America continues its impressive import growth, primarily driven by strong exports from the Far East. Meanwhile, the global price index stabilised, signalling a robust overall performance as we move toward the close of 2024. These trends indicate a market that, despite some regional fluctuations, is adapting and maintaining resilience.
Closing February: What will Q1 2025 bring?
As we close out February 2025, it’s essential to consider the external factors shaping global volumes. While the decline in volumes due to Chinese New Year was expected, the looming US tariff charges will likely slow down North American imports, which have been exceptionally high in recent months. Additionally, the recent reorganisation of container shipping alliances is impacting lifting dynamics and trade flows. As we turn our attention to March 2025 data, it will be intriguing to observe how these two final factors continue to influence trade and how Q1 2025 will conclude.
Stay informed and ahead of the curve with CTS – your trusted source for global container trade statistics.